

Alerts
Monita alerting has two layers. Auto Alerts watch everything by default — every vendor-event signal in your traffic, from the moment it first appears. Custom Alerts are your own rules for specific escalations: exact thresholds, data validations, journeys, with your own channels and severity. Both file into Issues.
Auto Alerts
Section titled “Auto Alerts”The Alerts page opens on the essentials: whether each engine is watching, your personal notifications (including your daily briefing), and a summary of your signals. Scan frequencies, sensitivity, the dev-environment toggle and seasonality live one tab over under Detection tuning.
Three engines run continuously:
- Volume — seasonal anomaly detection on every signal. Choose the scan frequency (every 15 minutes up to daily) and an org-wide sensitivity: high (more alerts), balanced, or low (fewer alerts).
- Data — AI review of payload drift per vendor, on a 6-hour, daily or weekly cadence.
- Compliance — PII-shaped values in payloads and blocked vendors still firing.
Every signal Auto Alerts watch is listed on the Signals page, with its trend, model readiness, open issues and label. Per signal you can set monitoring to On, Muted (tracked, no issues) or Off, and override the sensitivity, one at a time or in bulk. Opening a signal shows its anomaly chart with the expected band, plus a backtest: what each sensitivity level would have flagged over recent weeks. Click a level to preview its band on the chart before applying it.
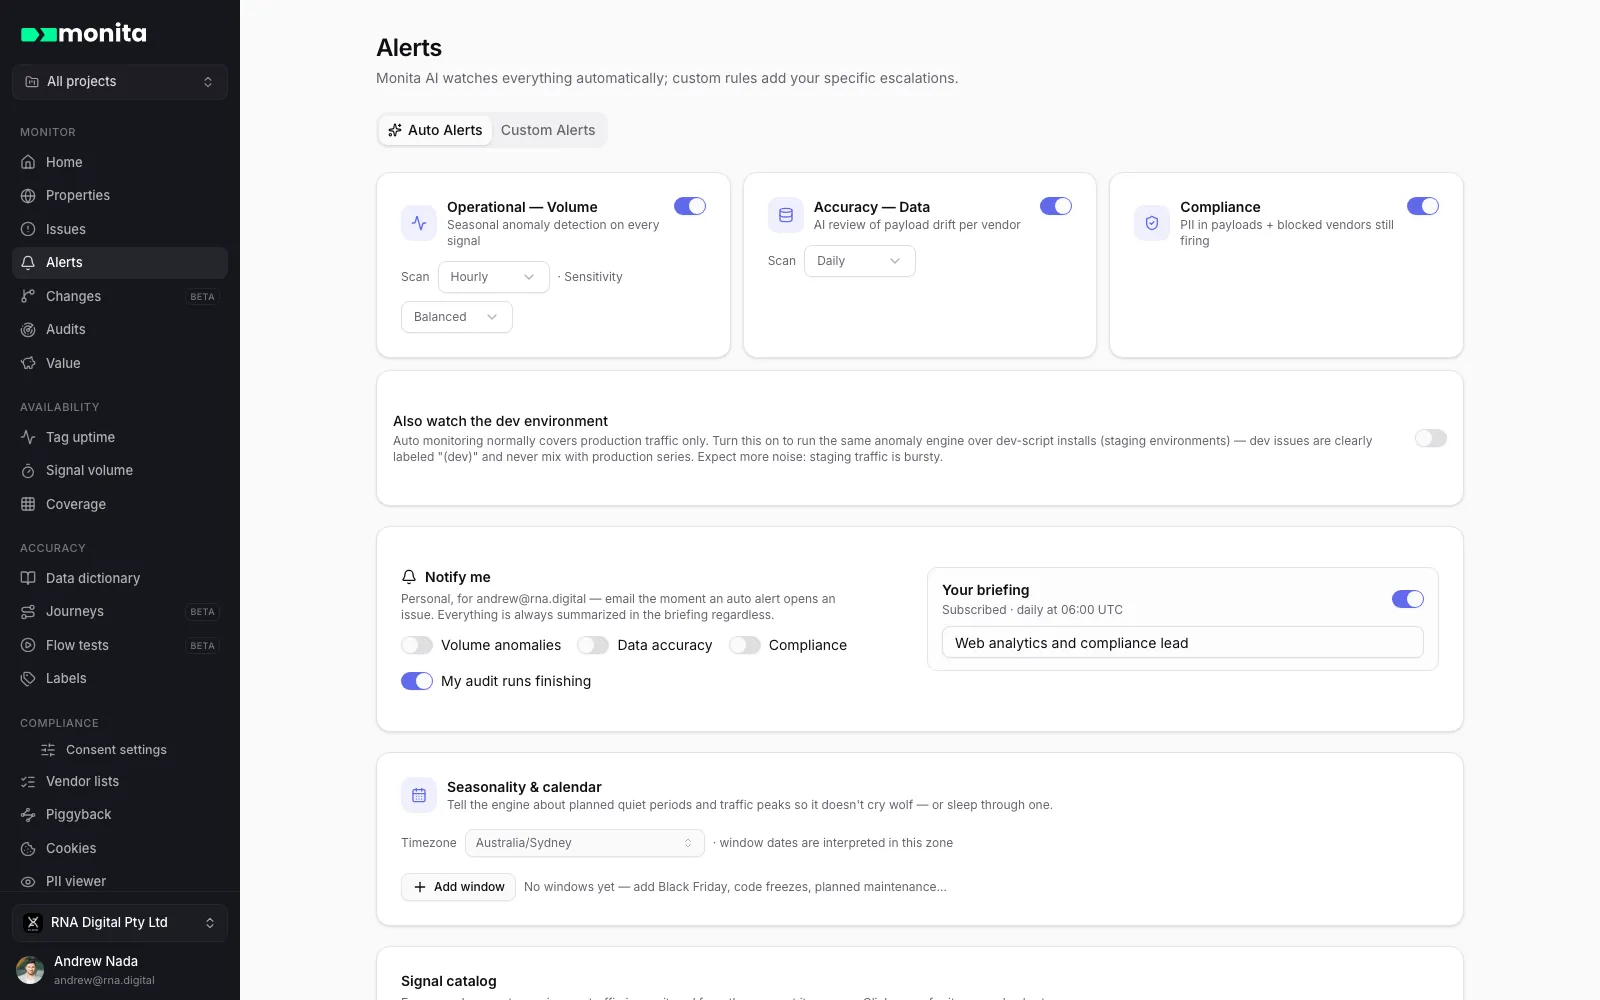
Seasonality & calendar teaches the engine your planned exceptions: add windows that either suppress alerts (maintenance, migrations, code freezes, an off-season) or declare elevated traffic (Black Friday, campaigns), optionally repeating annually. Set the org timezone here too — window dates are interpreted in it.
A suppress window pauses everything that counts volume: the Auto Alerts volume engine and your own volume rules (threshold, volume change and volume anomaly). No volume issue is opened inside the window, and a volume issue that was already open is resolved with the window named on its timeline, so the score reflects the season rather than the calendar. Data validation, journey, data drift and compliance checks keep running: a leak or a broken payload is real in any season. An elevated window widens what the volume engine expects and does not change your own rules.
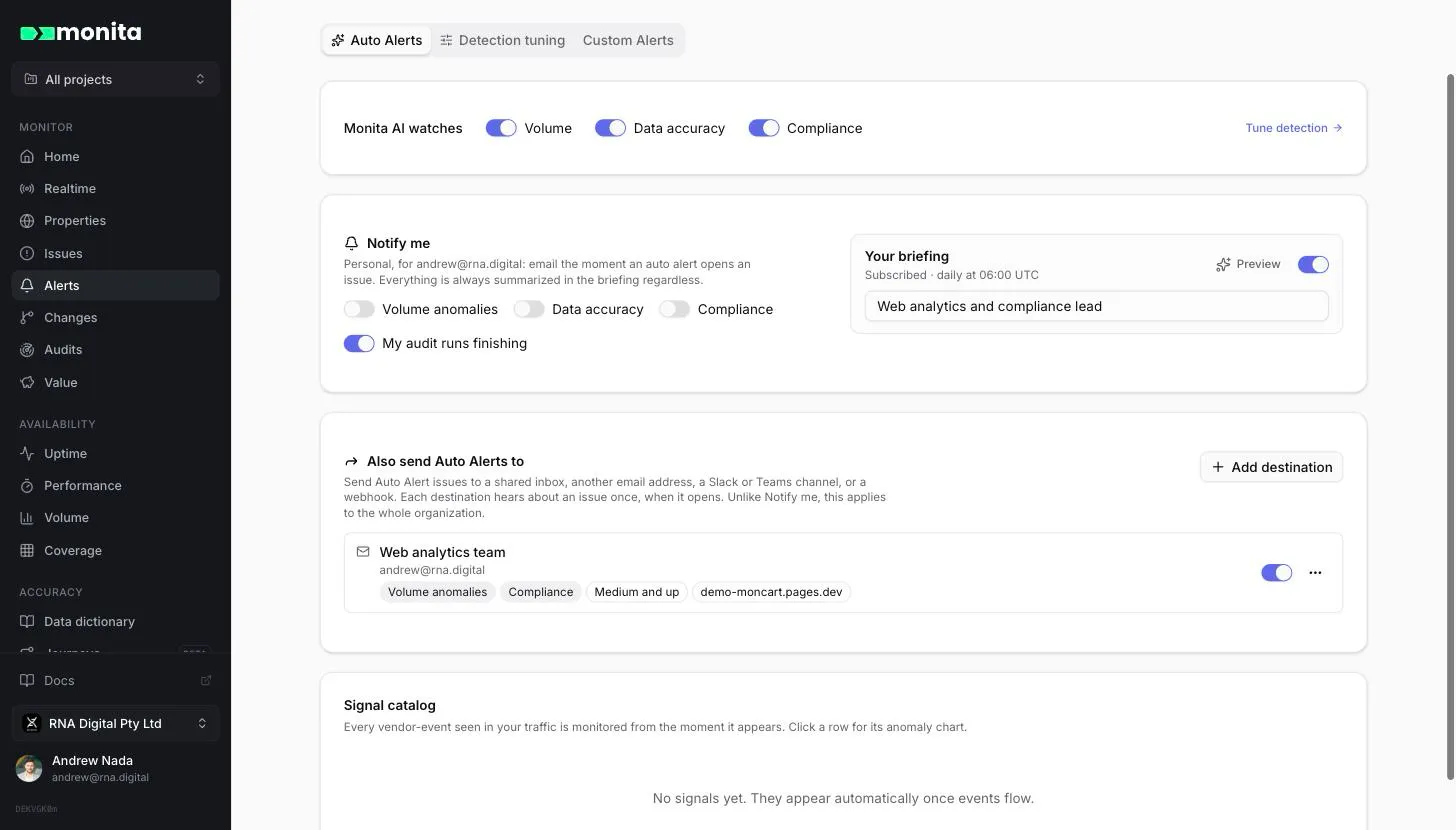
Notify me is personal: subscribe yourself to an email the moment an auto engine opens an issue, per pillar, and to your daily briefing — a recurring email written for your role.
Sending Auto Alerts to other destinations
Section titled “Sending Auto Alerts to other destinations”Notify me reaches the person who turns it on. To send Auto Alerts anywhere else, such as a shared inbox, a second email address, a Slack or Teams channel or a webhook, add a destination under Also send Auto Alerts to on the Auto Alerts tab. You don’t need a custom alert for this.
Each destination chooses:
- Where: one email address (people outside Monita and shared inboxes are fine), a connected Slack or Teams workspace and channel, or an https webhook.
- Which Auto Alerts: volume anomalies, data accuracy, compliance, or any mix.
- Minimum severity: for volume, a tag that stopped firing is high, a drop or slow bleed is medium and a spike is low. Pick Medium and up to hear about failures and drops without spikes.
- Which properties: all of them, or only the ones you choose.
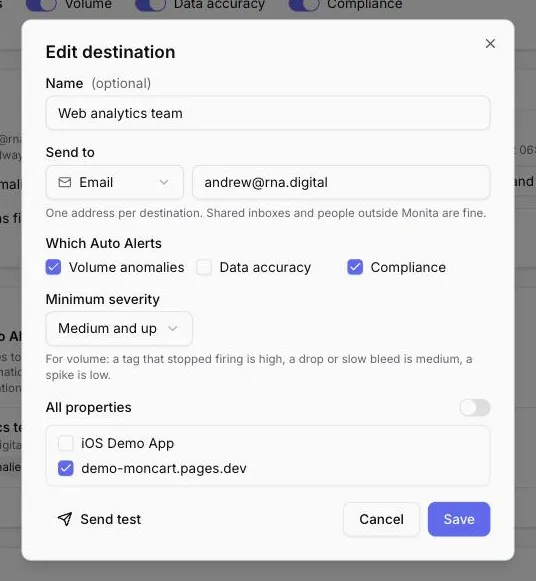
A destination hears about an issue once, when it opens, and never again while that issue stays open. Send test delivers a clearly labelled test message so you can check the destination before relying on it. Every delivery shows on the issue’s timeline as “Auto Alert destination”, and a destination that can’t be reached is recorded there too. The same safeguards apply as everywhere else: your calendar’s suppress windows, the pause after a traffic mix change, the daily email limit per address, and addresses that bounced earlier. An address that bounced is flagged on the card, because nothing reaches it until the mailbox works again.
Everyone in the organization can see the destinations. Only organization admins can add, change, pause or test them, because a destination emails people who never opted in themselves. Assistants connected through the MCP server can manage the same list with set_auto_alert_destinations.
By default the engines watch production traffic only; a toggle extends the same monitoring to dev-script installs (expect more noise — staging traffic is bursty).
Custom alert types
Section titled “Custom alert types”| Type | Fires when |
|---|---|
| Data validation | An event matches your conditions — the only type that can run realtime, evaluated the moment each event arrives. |
| Volume threshold | A full window’s count is at most / at least N. The honest replacement for “tag does not fire” — a whole window at ≤ N is real; a momentarily empty minute is not. |
| Volume change | The count moves by at least X% versus the prior period (hour-on-hour, day-on-day, and so on). |
| Volume anomaly | The ML seasonal engine flags one signal — same detection as Auto Alerts, but with your channels, severity and sensitivity. |
| Journey | Sessions on a path stop firing the tags the path requires — usually drafted from the Journeys page. |
Building a rule
Section titled “Building a rule”-
Define. Name the rule, pick the type and a severity (low → critical). Optionally attach a dollar impact — issues it raises carry that value.
-
Scope. Pick the properties (any subset, or all) and the vendor; leave the event blank to count everything the vendor sends.
-
Conditions. Data-validation rules are built from condition groups: each group matches ALL or ANY of its rows, and multiple groups are OR-ed together. Fields come from a catalog of what your traffic actually sends — envelope fields (event, vendor, URL, path, consent state, GTM tag name/status…) and every observed payload key per vendor, with presence and recency shown. Operators include equals/contains/starts-with families, blank checks, length and numeric comparisons, regex, and PII detectors (
contains email,contains phone). Value fields suggest observed values, and pasting a comma-separated list splits into one chip per value. Volume rules accept an optional “only count events matching…” filter with the exact-match operator subset. -
Period. Realtime (data validation only) or a comparison window from every 15 minutes to weekly — each scheduled check evaluates the window that just ended. Anomaly rules are pinned to hourly, the engine’s own grain. Scheduled rules can also be confined to a run window: specific local hours and days of the week, in the rule’s timezone.
-
Notify. Add destinations — see below. Realtime rules get a burst limit: at most N notifications per M minutes, while occurrences keep counting.
Preview and backtest
Section titled “Preview and backtest”- Live preview (data validation): as you edit conditions, Monita evaluates the draft against a sample of your last 24 hours with the production engine — matched counts and expandable matching events, before you save. When every group pins one vendor, the sample is drawn from that vendor’s events.
- Backtest (any type): replay the draft against 7, 14 or 30 days of history and see exactly when it would have fired — before it pages anyone. Conditions on payload fields are checked event by event within the rule’s vendor, event and URL conditions. If the range holds more in-scope events than one replay reads, the chart says how far back it reached; narrow the conditions or shorten the range for an exact replay.
When a realtime change takes effect
Section titled “When a realtime change takes effect”Realtime rules are checked at the edge, next to your traffic, so each location keeps its own copy of your rules. After you create, edit, enable, disable or delete a realtime rule, every location has the change within 2 minutes; many pick it up sooner. Until then the previous version can still match, so a rule you just disabled or deleted may fire once more in that window.
The Alerts list shows the countdown next to the rule’s switch: Live in 1:42 while a change is on its way, Stops in 0:37 after you disable one, then Live everywhere once it has landed. Scheduled rules read their settings at each run and take effect on the next check.
How scheduled checks read your traffic
Section titled “How scheduled checks read your traffic”Each scheduled data-validation check reads every event in the window that matches the rule’s vendor, event and URL conditions and evaluates the payload conditions on each one, up to 50,000 events per check. When a window holds more than that, the most recent are checked and the issue’s “What was detected” card shows the share that was covered. Shorter periods keep busy properties inside that ceiling.
Destinations
Section titled “Destinations”Rules deliver to email (multiple recipients — one entry each on the issue timeline), Slack, Teams and webhooks; Jira files issues through its own auto-file rules. Connect Slack and Teams once under Integrations and they become one-click targets, with a per-rule override of the default channel. You’re notified when a rule opens an issue and again when it recovers — checking often never means paging often.
Manage rules
Section titled “Manage rules”- Enable / disable with the switch on any row — disabled rules keep their configuration but stop evaluating.
- Bulk actions: select rows to enable, disable or delete together. Deletion is permanent.
- Export / import: download all rules as JSON and bulk-import the same shape — useful for promoting alert sets between organisations. The import dialog includes a ready-made prompt you can hand to any AI assistant; it embeds the format and your current rules so the assistant writes valid JSON in your house style. Or skip JSON entirely and manage alerts conversationally through the MCP server.