

Verifying network requests
The definitive way to confirm client-side data is flowing: watch the beacons leave the browser.
Check the Network tab
Section titled “Check the Network tab”-
Open Chrome DevTools (F12), select the Network tab, and reload the page.
-
Filter for
collect.monita.ai(properties installed before mid-2026 may still send tostream.raptor.digital— both are valid). -
Fire a monitored vendor (a page view is enough if you monitor an all-pages vendor).
-
You should see
POSTrequests to/api/v1/returning204. Click one and inspect its Payload — thevn/efields show which vendor and event were reported.
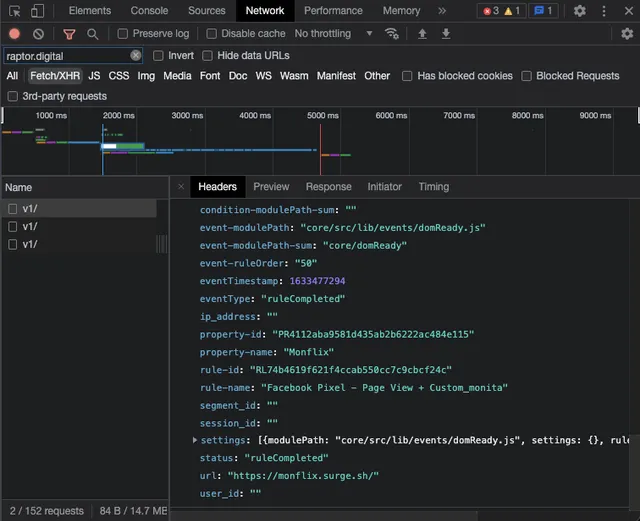
What the requests look like
Section titled “What the requests look like”- The global script sends beacons, so requests may appear with type ping and content type
text/plain— that’s normal; the body is still JSON. - GTM container monitoring sends
fetchrequests with atokenheader; you may see a matchingOPTIONSpreflight first. Also normal. - Events batch — one request can carry many events, so expect fewer requests than events.
Status codes
Section titled “Status codes”| Status | Meaning | What to do |
|---|---|---|
204 |
Accepted (success — there is never a response body) | Nothing — check the Visualisation view next |
401 |
Token missing or not recognized | Redeploy with the token from Manage → Installation guide; if the property was just created, retry shortly |
400 |
Malformed request body | Usually a modified snippet — reinstall the unedited snippet |
404 |
Wrong path | The endpoint is exactly /api/v1/ |
Blocked / (failed) |
Ad blocker or network filter | Disable ad blockers when testing |
Turn on debug logging
Section titled “Turn on debug logging”The script can log its activity to the console — set a cookie and reload:
document.cookie = 'rap_info=true'; // log every payload sent (MONITA-SEND)document.cookie = 'rap_debug=true'; // verbose: every intercepted requestdocument.cookie = 'rap_err=true'; // setup errors onlyTwo messages matter most:
MONITA-SEND— the script sent a beacon; the logged object is the exact payload.MONITA NO MATCH— the script saw a vendor request that matched none of your configured vendors. If a tag fires but never appears in Monita, this is almost always why: check the vendor’s Domains pattern in its configuration.
Clear the cookies (or set them to false) when you’re done.
No requests at all?
Section titled “No requests at all?”Then the script isn’t loaded or isn’t seeing traffic — go back to Deployment troubleshooting.