

Deployment troubleshooting
Deployed Monita but the dashboards are empty? Work through these checks in order — they resolve nearly all “no data” cases.
1. Confirm the change is actually published
Section titled “1. Confirm the change is actually published”Google Tag Manager
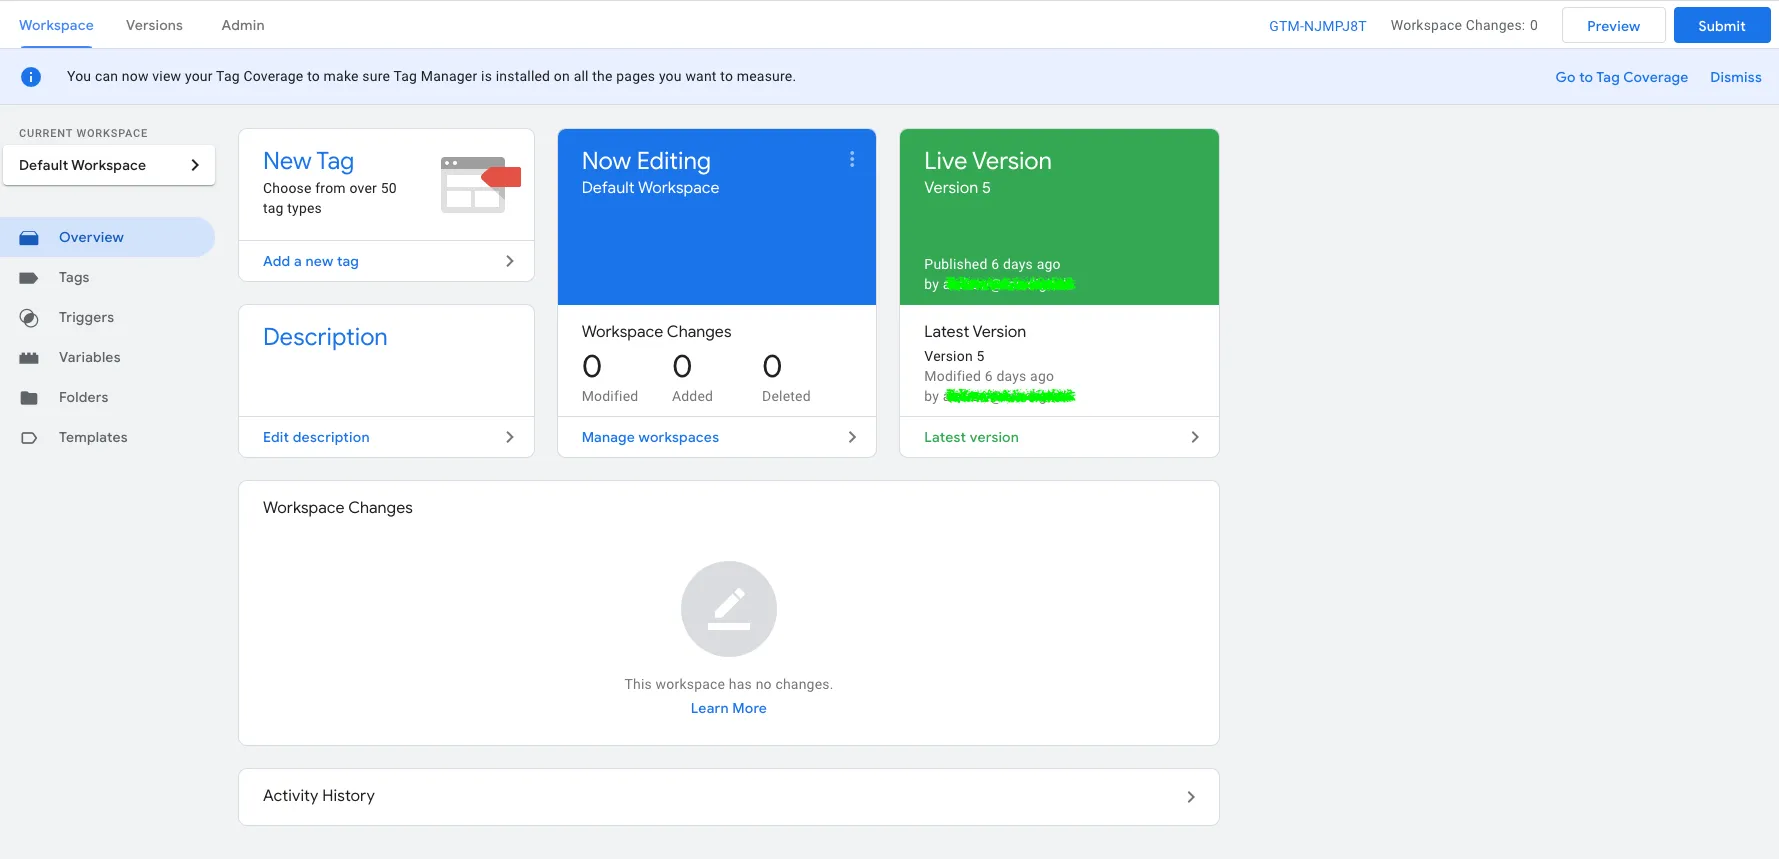
Make sure Monita’s changes in the container have been submitted and published — not just saved in the workspace. Be careful not to publish unrelated unfinished work at the same time.
After submitting, the workspace changes list should be empty and the container version incremented.
Adobe Launch
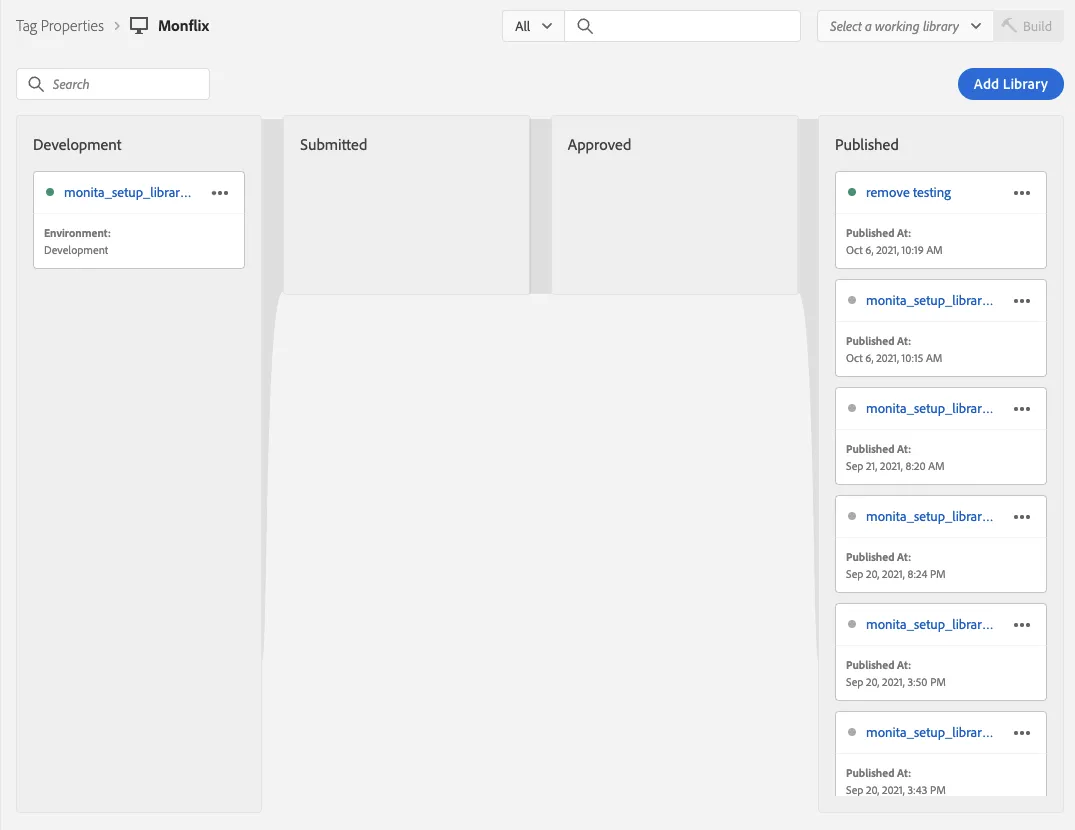
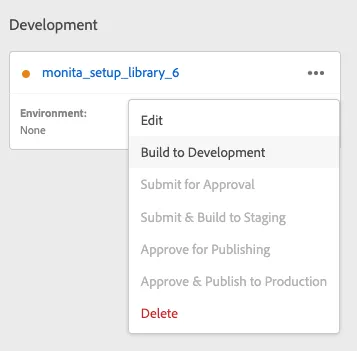
The library containing Monita must be built and published to the environment you’re testing (dev/staging/prod). A library sitting in Development while you test production is the most common Adobe cause.
Tealium iQ / Commanders Act
Save and publish the profile or container after adding the Monita extension/tag. Verify the version you published is the one serving your test environment.
2. Confirm the script is on the page
Section titled “2. Confirm the script is on the page”-
Visit the monitored site with ad blockers off.
-
In the browser console, type
__monita_settings. If it’s defined, the script loaded; it also shows the deployed script version, which should match the deployment version shown on your property. -
If the script recently changed and you suspect a stale copy, add
?monitarefresh=1to the URL and reload.
3. Confirm monitored tags are firing
Section titled “3. Confirm monitored tags are firing”Monita only receives data when the vendors you monitor actually fire. Trigger them deliberately (page views for an all-pages pixel, a test conversion, etc.). We recommend monitoring at least one all-pages vendor so there’s always a heartbeat.
4. Confirm beacons reach Monita
Section titled “4. Confirm beacons reach Monita”Open the Network tab and filter for collect.monita.ai — you should see POST requests returning 204. The full guide, including status-code meanings and debug logging, is at Verifying network requests.
5. Confirm events arrive in the platform
Section titled “5. Confirm events arrive in the platform”In the app, open the property’s Visualisation view. Events are grouped by vendor and event name. For a live per-event stream instead, open Monitor → Realtime and press Live: see the Realtime view.
Still stuck?
Section titled “Still stuck?”Email support@getmonita.io with your property name, the page URL you tested, and a screenshot of the Network tab filtered to collect.monita.ai — that’s usually everything needed to diagnose.