

Issues
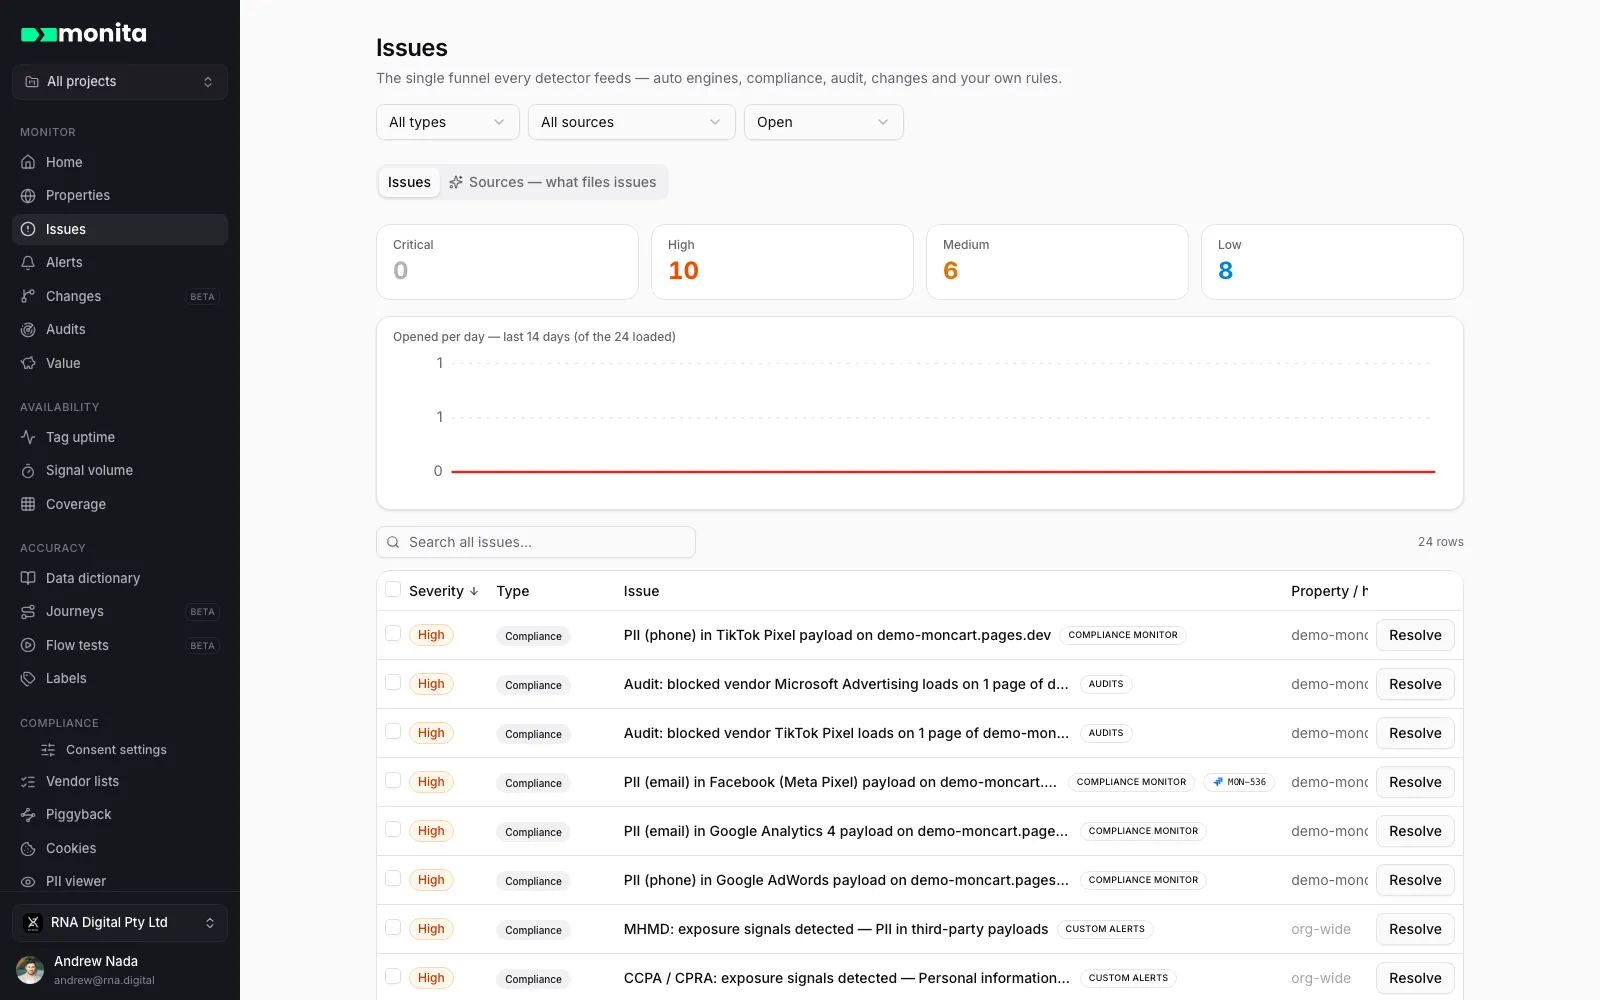
Issues are the single funnel every Monita detector feeds. Whatever finds a problem — an automatic engine, a compliance monitor, an audit, a change watch or one of your own alert rules — it files an issue here, with one lifecycle and one triage surface: app.monita.ai/issues.
What files issues
Section titled “What files issues”The Sources tab on the Issues page shows the live version of this table — what each source has filed and where to tune it.
| Source | What it files |
|---|---|
| Auto — volume anomalies | The seasonal engine scans every vendor-event signal on your chosen frequency. Zeros, drops, spikes and traffic bleed file here; recoveries auto-resolve after three healthy hours. |
| Auto — data anomalies | Payload drift with a reviewed verdict: vanished keys, blanked values and format breaks, each issue with a concrete recommendation. |
| Compliance monitor | PII-shaped values detected in vendor payloads, blocked vendors still firing, regulation exposure, a consent signal that stopped arriving, and findings you file from the PII deep scan. |
| Audits | Real-browser audit runs: blocked vendors still loading, unreviewed vendors piggybacking in through other vendors’ scripts. |
| Change confidence | Detected stack changes (a GTM publish, a TMS/CMS/CMP swap) open watch windows on the signals they can affect; a regressed verdict files an issue. A sudden traffic-mix change (for example a staging to production cutover) files a notice here too. |
| Script installation | Monita loading more than once on the same pages, which can leave a property with missing vendor data. Filed as critical, emailed to your organization’s owners and admins, and resolved automatically once a day passes without the conflict. |
| Custom alerts | Only your own alerts: data validation, thresholds, volume changes and journeys, with your own channels and severity. |
The issue lifecycle
Section titled “The issue lifecycle”Every source writes into the same lifecycle:
- Deduplicated per signal. A recurring problem is one issue that accrues occurrences, not a fresh page every hour. Occurrences count the events that matched across every check, not the number of checks that ran: one check that matches forty events adds forty occurrences. Occurrences keep counting even while notifications are throttled, and the Details panel shows both numbers.
- Notified on open and on recovery. You hear when an issue opens and when it recovers; in between, further firings land on its timeline without paging anyone.
- Auto-resolved where the detector can prove recovery. Volume anomalies resolve themselves after three consecutive healthy hours, and script installation issues after a day without the conflict; other sources resolve when you (or Jira — see below) close them.
- Closed when nothing watches them. Disabling or deleting a rule closes its open issues, and deleting a property closes every issue on it, each with the reason on the timeline. An issue never stays open with no rule behind it.
- Paused by your calendar. When a suppress window on the Seasonality calendar starts, open volume issues are closed with the window named on their timeline. That is a pause, not a recovery, and the briefing reports it as one.
Severity
Section titled “Severity”Issues carry a severity of critical, high, medium or low. Automatic engines assign severity from the size of the deviation; custom rules use whatever severity you set on the rule. The four cards at the top of the list are also filters — click one to focus the table.
Triage
Section titled “Triage”- Statuses: open → acknowledged → resolved, plus muted for known noise. Reopen anytime.
- Resolve inline from the list, or open an issue for its full detail: the live signal chart behind the issue (actual vs the expected band), the detected payload, a per-day occurrence history, the notification timeline and free-text notes.
- Data validation issues show what matched. An issue from a data validation alert names the condition that matched and the observed value from the example event, so you can see the bad value without opening the payload. Sensitive values are masked.
- Bulk triage: select any set of rows and resolve, acknowledge or reopen them together.
- Filters live in the URL — property, host, pillar, type, source, status, severity — so a triaged view is a shareable link. The search box queries the server, reaching issues older than the loaded window.
- From the Home scores: clicking the Availability, Accuracy or Compliance score opens this list with the pillar filter set to it (the Type list then offers only that pillar’s types), and the Monita Score opens every open issue. Accuracy and Compliance list exactly the issues that lower those scores. Availability is scored from hourly uptime, so its list shows the volume issues (tags that stopped firing, dropped or spiked) with a link to Uptime for the hours behind the number.
- Value protected: rules can carry a dollar impact; resolved issues accrue it on the Value page.
Jira two-way sync
Section titled “Jira two-way sync”With the Jira integration connected, issues can be filed to Jira automatically (above a severity floor you choose) or manually from any issue’s Create Jira issue button. The link is two-way:
- Moving the Jira ticket to a Done-category status resolves the Monita issue.
- Recoveries and resolutions in Monita comment on the Jira ticket.
The linked ticket key appears on the issue and in the list. Issues can also route to Slack, Teams, webhooks and email through your alert rules.