

Uptime and volume
Two views answer the two everyday questions about your signals: is everything firing right now? (Uptime) and how much is each signal sending, and is that normal? (Volume).
Uptime
Section titled “Uptime”Uptime shows an hour-by-hour strip for every property, drilling down to each vendor and each individual event. Every cell is scored by the anomaly engine against that hour’s seasonal expectation — not mere presence. A signal limping at 10% of its normal volume is not green.
Cell states:
- Healthy — the hour landed inside its expected band.
- Degraded — traffic arrived, but well below expectation.
- Not firing — the hour expected traffic and got none.
- No traffic expected — quiet hours (3 a.m. on a B2B site) don’t count against you.
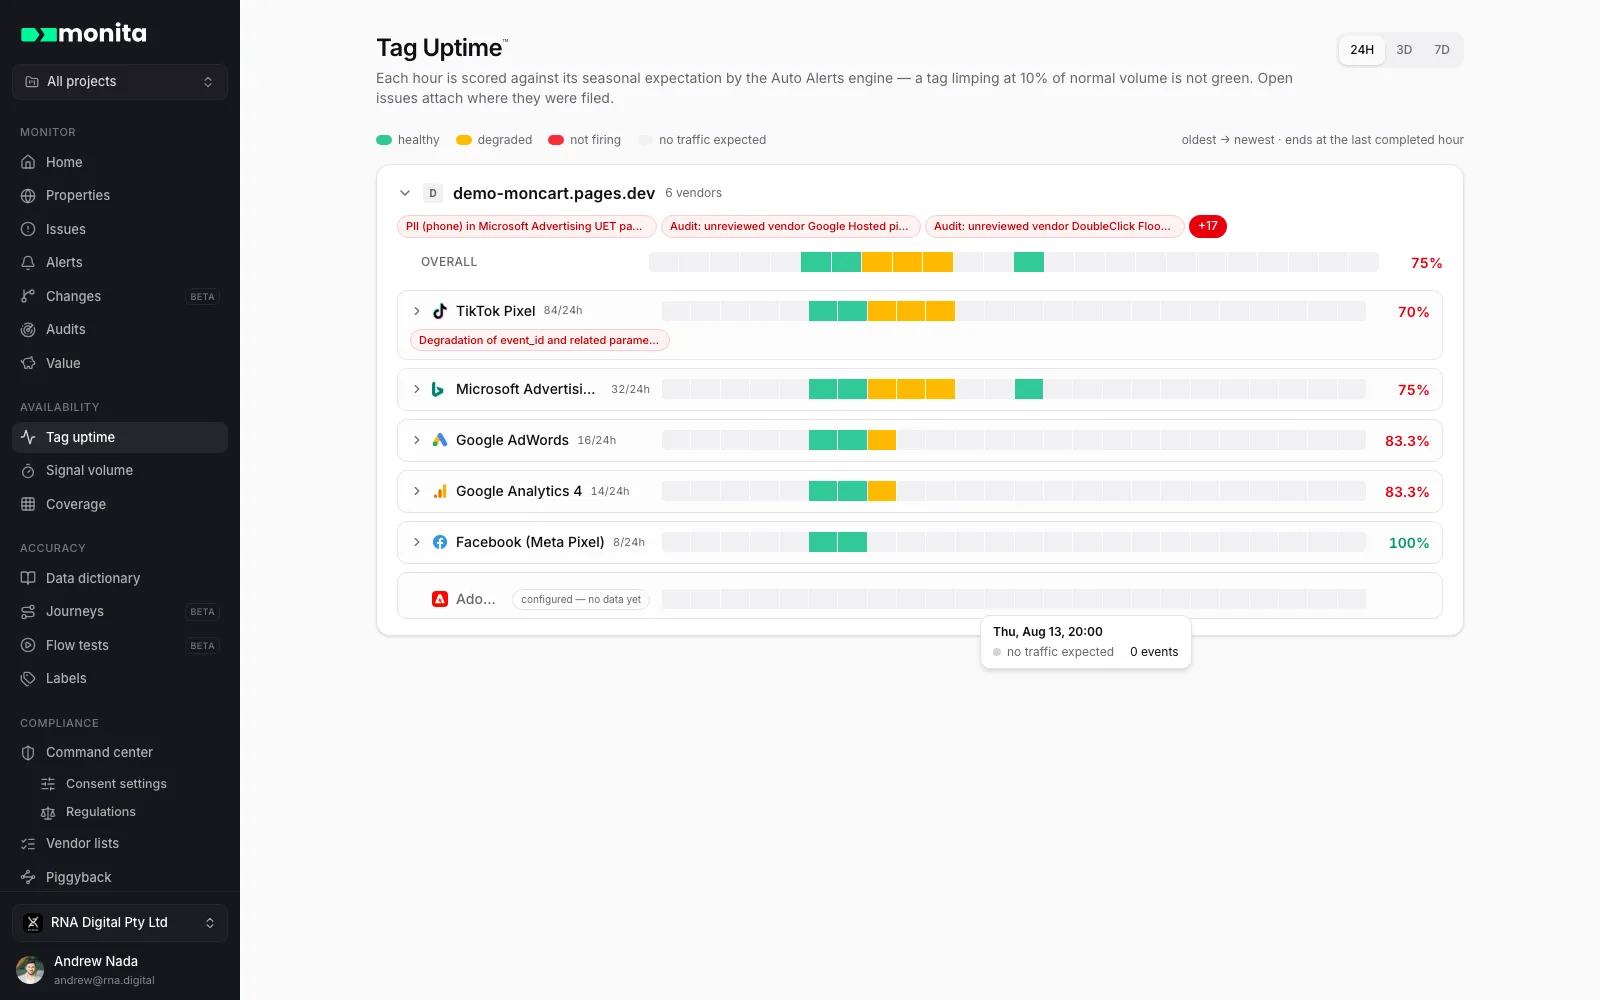
The uptime percentage is computed only over hours that expected traffic — a signal that was idle all window shows as idle, not a misleading 100%. Signals that are configured on a property but have never been observed are listed explicitly with a configured — no data yet badge, so a silent signal can’t just vanish from the screen.
Open issues attach to the row where they were filed — property, vendor or event — and link straight through. Windows: 24 hours, 3 days or 7 days, always ending at the last completed hour.
Volume
Section titled “Volume”Volume is the catalog of every vendor-event signal with its volume over the selected window, its change versus the prior period, and a trend sparkline. Expand any row for the engine’s expected-vs-actual chart — the same series behind Auto Alerts and issue pages.
Organised by meaning
Section titled “Organised by meaning”The default grouping is by label: events that record the same user action share one label, so a GA4 purchase, a Meta Purchase and a TikTok CompletePayment roll up under one “Purchase” row instead of one row per vendor. Monita suggests labels once a day; you can label signals immediately on the Labels or Signals page. Labels are first-class everywhere else too — journey alerts and alert conditions can target a label bucket and cover every vendor spelling at once.
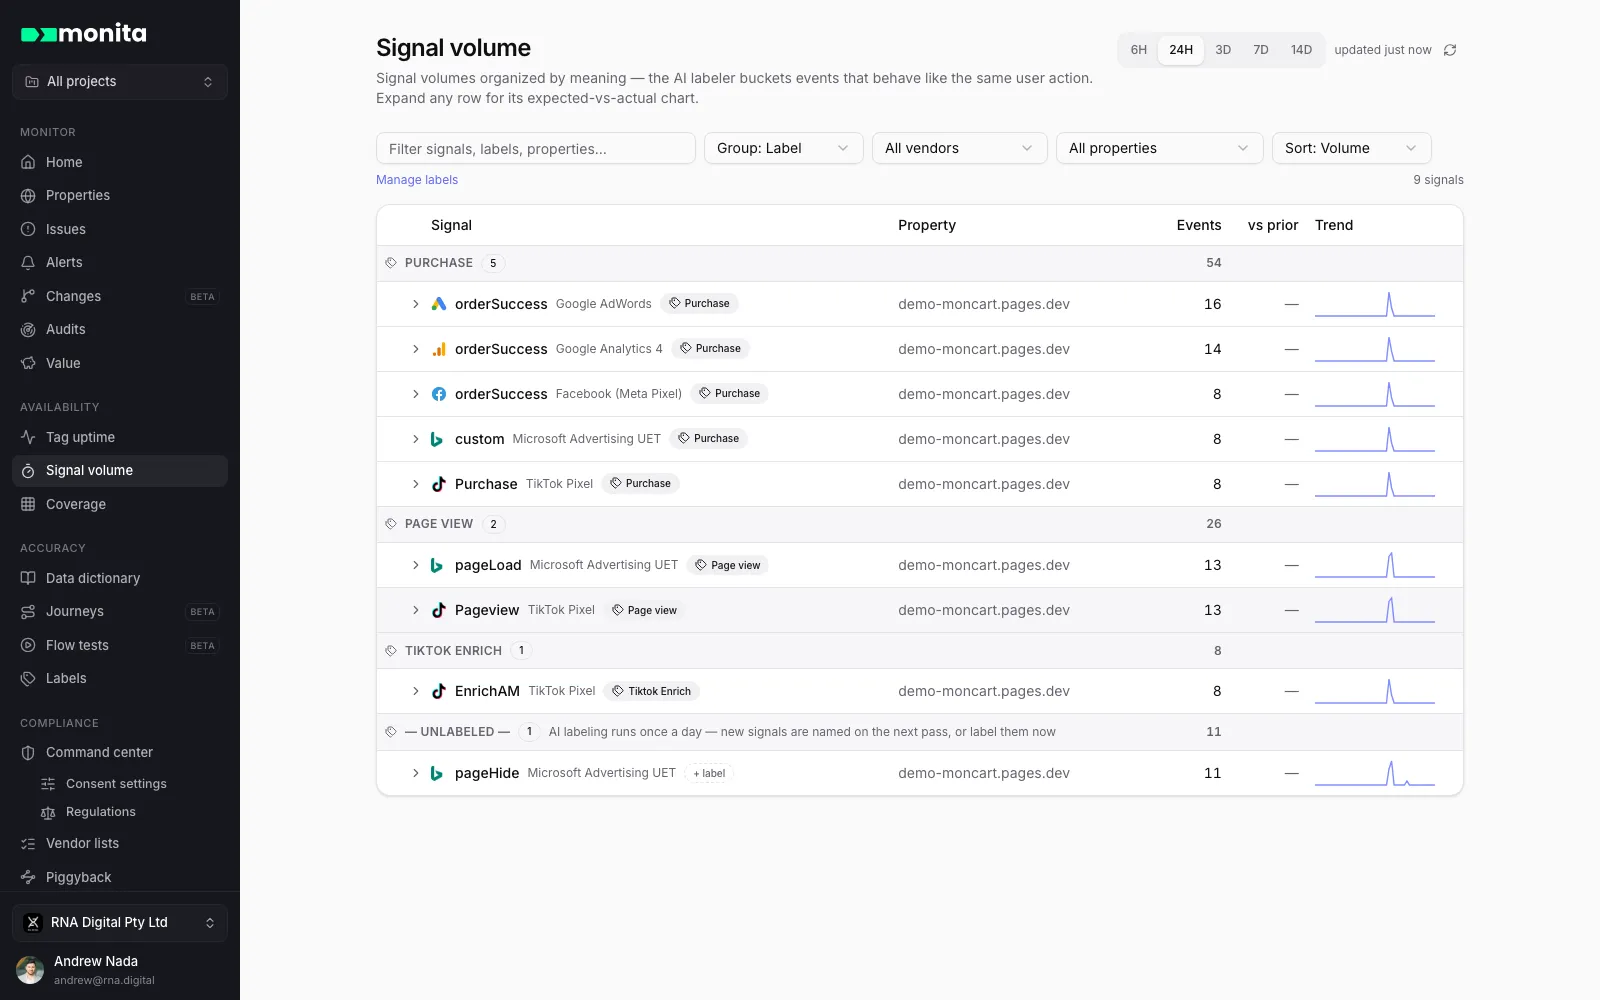
Regroup by vendor or property, sort by volume or biggest drops, and filter freely — every control lives in the URL, so a filtered view is a shareable link.
Production and dev stay separate
Section titled “Production and dev stay separate”The environment toggle switches between production and dev-script traffic; the two are never mixed. A quiet banner also flags signals seen only in dev over the last week — a tag that made it to staging but never shipped.